Grasana: representing Asana projects as graphs/trees
go to repohaskell + typescript
At Converge we use Asana to manage a lot of projects, and I was trying to do some outcome mapping for some of our objectives, but was finding the lack of a graph-like representation was preventing me from reasoning easily about projects stored in Asana. I ended up representing my project in Coggle for precisely this reason.
Given that we also need to manage these projects, not just reason about them, I looked around for a way to render an Asana project as a graph, or at least as a tree, but found nothing that suited me.
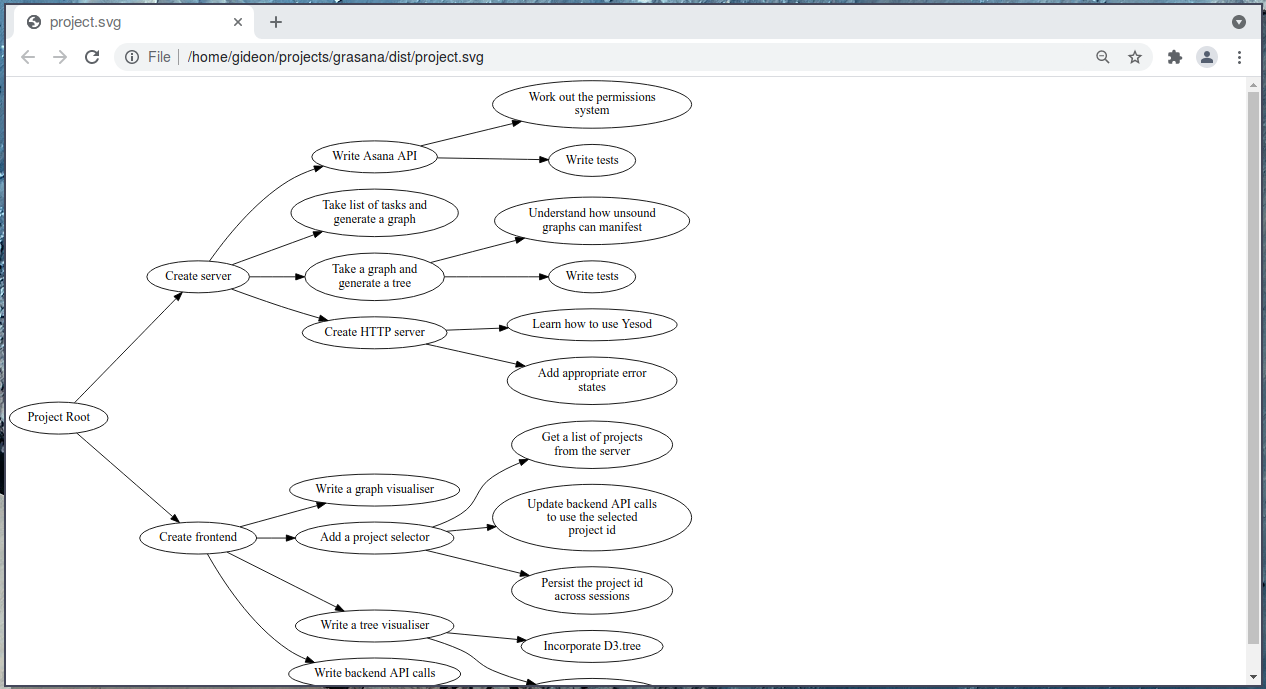
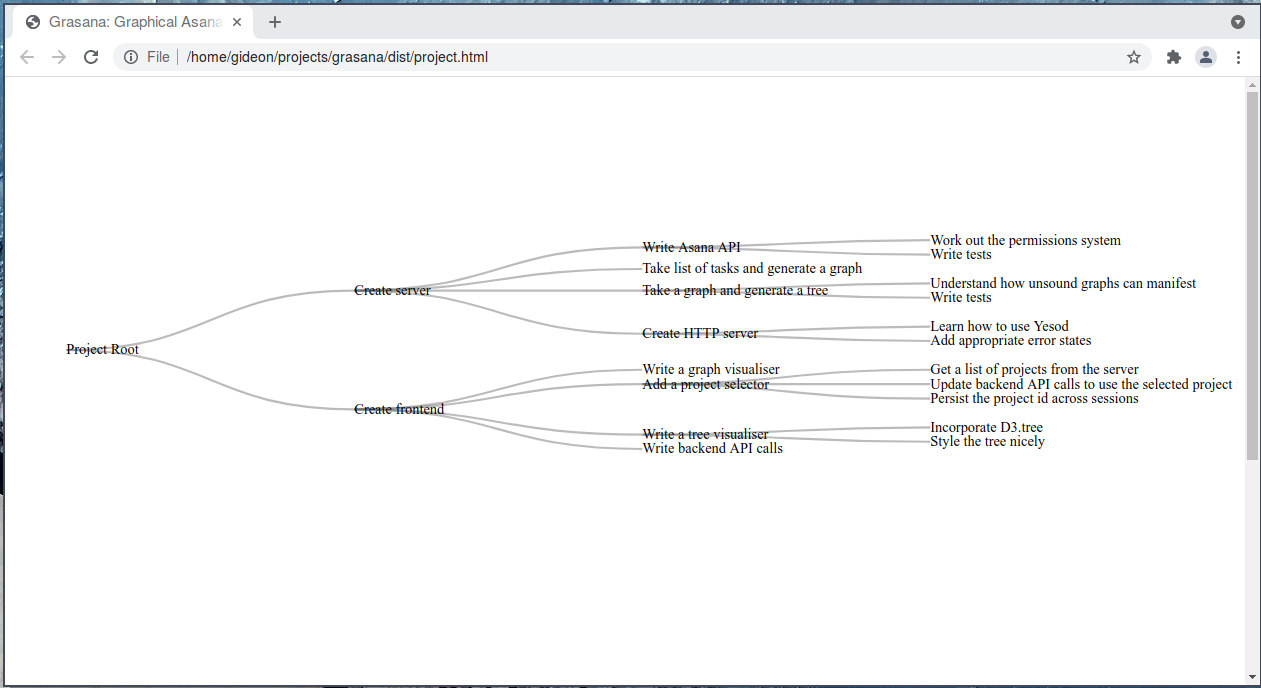
Thus Grasana was born, but was originally intended to be a sort of web app, complete with oauth, project selection, etc., but I decided that this was overkill and made it into a command-line utility instead which could take an Asana project and output a graph or a tree in either DOT, JSON, or HTML formats.
This was a really excellent project for learning more about Template Haskell, HTTP in Haskell, and concurrency. It also was just another useful way of increasing my familiarity with core Haskell concepts.
Grasana is quite simple to use:
grasana -t token format projectid
I typically just pipe the output to dot or to an html file and then load the resulting svg / html in a browser, for example:
grasana -t token dot projectid | dot -Tsvg > project.svg
firefox project.svg

grasana -t token html projectid > project.html
firefox project.html


The one thing I had not managed to work out during the course of the project (yet) was how to test the HTTP requests I’m making to the Asana API. In javascript there are great libraries like nock for mocking HTTP requests, but for Haskell it’s a bit more complicated. I have some ideas of how to pursue this as I think it will be a really interesting use of monad transformers but that’s for another day.